

We are pleased to share these latest property insights from economics expert, Tony Alexander. In Tony’s series with us he discusses the property market, trending patterns and economic insights. Sign up to our newsletter to get his next article straight to your inbox.
Each month renowned economist, Tony Alexander will be writing a monthly update on the property market, trending patterns and economic insights. Sign up for our newsletter to follow his and Safari Groups articles on Property Development.
Tony Alexander - August 2022 Property Market Insights
Photo – Augustus Park, Parnell
WHICH IS LEADING AND WHICH IS LAGGING?
In the world of economics there are some things we call leading indicators and some we call lagging indicators. The latter mean things that change after the economy has already started moving in that direction. An example of this is employment alongside the unemployment rate.
Businesses usually wait to be certain that the economy has weakened and demand for their output has fallen away before laying people off and incurring redundancy costs. They ‘lag’, knowing that even more cost will be involved down the track when one day they need to rehire.
An example of a leading indicator is consumer confidence. When householders get pessimistic about the outlook of the economy and their situation, we know that very soon there will be weakness in household spending. That in turn will lead to reduced output by goods and service providers who, as noted above, will eventually respond by cutting staff numbers.
How is this relevant to where the house construction industry is going? One of the biggest leading indicators of a change in the level of house construction is a change in the number of consents issued for new dwellings. A traditional leading indicator for changes in consents is a change in dwelling sales.
CONSENTS VS SALES
Data from the Real Estate Institute of New Zealand (REINZ) tell us that over the three months to July the number of dwellings sold around the country was down by 33% from a year earlier. Auckland was down 41%, Wellington 29%, Waikato 36%, and Canterbury 26%.
The annual number of dwelling sales nationwide now stands at just under 72,000 from a peak in June last year of just over 100,000. This is the lowest annual total in a decade, excluding the temporary impact of the pandemic’s onset. In seasonally adjusted terms, numbers fell by 7% in the three months to July, so the decline is continuing.
For real estate agents, times are now tough and set to get tougher for a few more months as buyers stay in the shadows, wary of prices falling further, concerned about high interest rates, and struggling to get a mortgage.
For home builders, the short-term implications are minor because of the massive backlog of work to be done. This includes projects delayed by the surprising materials shortage and the reduction in the availability of staff, as the unemployment rate has fallen to 3.3% from 4% just ahead of the pandemic.
But there is a well-established relationship between changes in dwelling sales and consents as shown here.
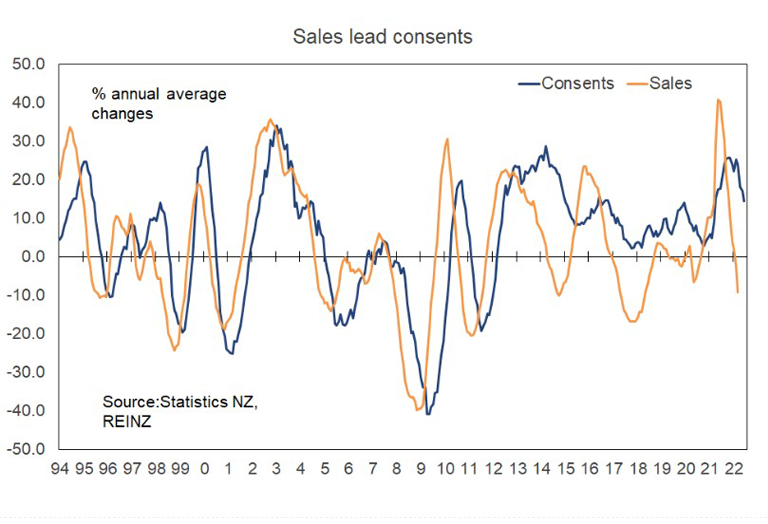
The orange line to the right side has fallen sharply and the blue consents line is shifting down also. Note that from 2012 falls in sales have not fed through to falls in consents as much as in the past. That is because of the nationwide drive to boost house construction in response to concerns about rapidly rising prices and the difficulties being experienced by young people in getting on the housing ladder.
Those concerns remain, and efforts continue to boost house supply as much as possible, most recently through the three dwellings with three storeys intensification change sweeping through much of the country.
CONSENTS VS CONSTRUCTION
So, falling sales mean falling consent issuance, with consents falling in seasonally adjusted terms by a (so far) relatively minor 3% in the June quarter. But what about the relationship between consent changes and actual construction?
Shortages of people and materials, versus more than enough developers and acquired consents for the home building sector to handle, indicates that there has not been a construction boom to the extent the consent data would suggest.
The following graph uses data from Statistics New Zealand. The volume of completed house construction work is indicated by the blue line. Annual consent numbers are shown by the orange line. Note that they tend to move together but that recently the growth in consents has not been matched by the same growth in construction.
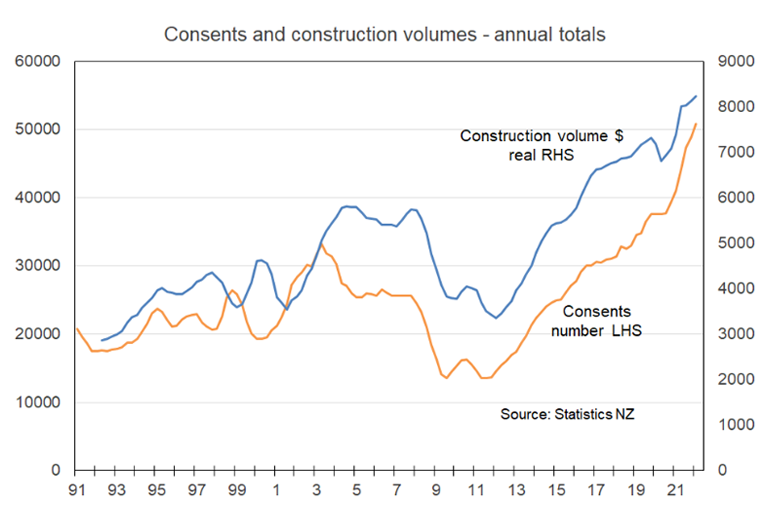
With consent numbers now starting to ease off we can expect building levels to soon ease also. But while annual consents may decline from 51,000 towards 35,000, construction will show less of a proportionate decline because of the backlog of work still to be done.
THE POSITIVE IN THE NEGATIVE
This is where the discussion about leading indicators becomes relevant again. I track many gauges of sentiment towards the residential property sector and most recently, virtually all of them have been negative. They tell us that for the next few months we will continue to see falling sales, falling prices, rising inventories of unsold existing stock, and lengthening times taken for dwellings to sell.
But the degree to which these measures are negative is easing. They don’t tell us yet that more buyers are coming out of the shadows, just that lesser numbers are stepping back from the market as each month goes by.
We are approaching a turning point in the residential real estate sector with three key things to watch as a gauge for when the property demand cycle once again turns back up. These things, already mentioned above, are falling prices, high interest rates, and access to finance.
Data from my surveys of mortgage advisers and residential property investors show that access to finance is improving. Banks have become more used to operating under the new Credit Contracts and Consumer Finance Act (CCCFA) rules and the peak period of the credit crunch ended some five months ago. Before the end of this year the Reserve Bank is also likely to ease loan-to-value-ratio (LVR) rules slightly.
Bank mortgage rates have already fallen 0.2% – 0.4% from their peaks in June, as global investors have focussed on rapidly slowing growth offshore, early signs of falling inflation, and expectations that central banks will start cutting their cash rates before the end of 2023.
With NZ banks eager to keep clients rolling off record low fixed rates, wanting to present a good offering heading into the traditionally active spring season (and perhaps wanting to shift their competition focus away from generous cashback deals), further falls in mortgage rates are highly likely in coming months.
Finally, when will buyers become less worried about falling prices? Not for some months yet. But with building costs continuing to rise, the labour market still strong, mortgage rates falling, and the stock of listings high, many are soon going to focus more on securing a house to live in and raise a family rather than picking the absolute bottom of the price cycle.
2023 AT A GLANCE
The seeds are being sown for a turning of the house price cycle within the next 6-9 months. When that happens, the ending of a period of falling sales will give us greater insight into when the decline in consent numbers may come to an end. That decline is only just starting, and it could run all through 2023.
The shortage of entry-priced housing in many parts of the country, alongside the shortage of social housing and the growing queue of eager buyers waiting for conditions to be right tells us something important. Once the stock of listings starts falling again, attention will again shift back towards getting a new house built or buying off the plan rather than just perusing the stock of existing properties for sale. This could happen at some point in 2023.
Relevant to that and as a final point, these numbers should be noted. The stock of property listed for sale sounds high when we note numbers are 104% up from a year ago and at their highest level (27,878) since the end of 2015. But the latest number is still 21% below the long-term average and 38% down from ten years ago.
For operators in the home building sector and people considering buying a new home, it is those stock numbers which need to be looked at as we move through the next 12 months. The dropping away of stock numbers to below 14,000 late last year appears to have been the key factor causing the extra and unusual 11% spike in house prices despite rising interest rates, falling credit availability, and new tax rules hitting investors.
Did you like this article? Read more insights from Tony Alexander here.
Tony Alexander is an economics commentator and former chief economist for BNZ. Additional commentary from him can be found at www.tonyalexander.nz